Warning: Undefined array key "post_type_share_twitter_account" in /var/www/vhosts/casinonewsblogger.com/public_html/wp-content/themes/cryptocurrency/vslmd/share/share.php on line 24
Single British renters are bearing the brunt of soaring rental costs with no one to split the bills. With over 8 million people living alone in Britain and rental prices continuing to climb faster than wages, choosing where to live as a single person can mean the difference between financial comfort and constant money stress.
Outplayed’s comprehensive analysis of 62 cities across Great Britain reveals dramatic disparities in housing affordability for singles, with renters in the most expensive cities spending more than double the proportion of their income on rent compared to the most affordable locations. Using official data from the Office for National Statistics, Outplayed created the definitive ranking of where single Brits face the biggest and smallest financial burden from renting a one-bedroom home.
Where being single is a financial nightmare in 2026: Interactive Map
Embed code:
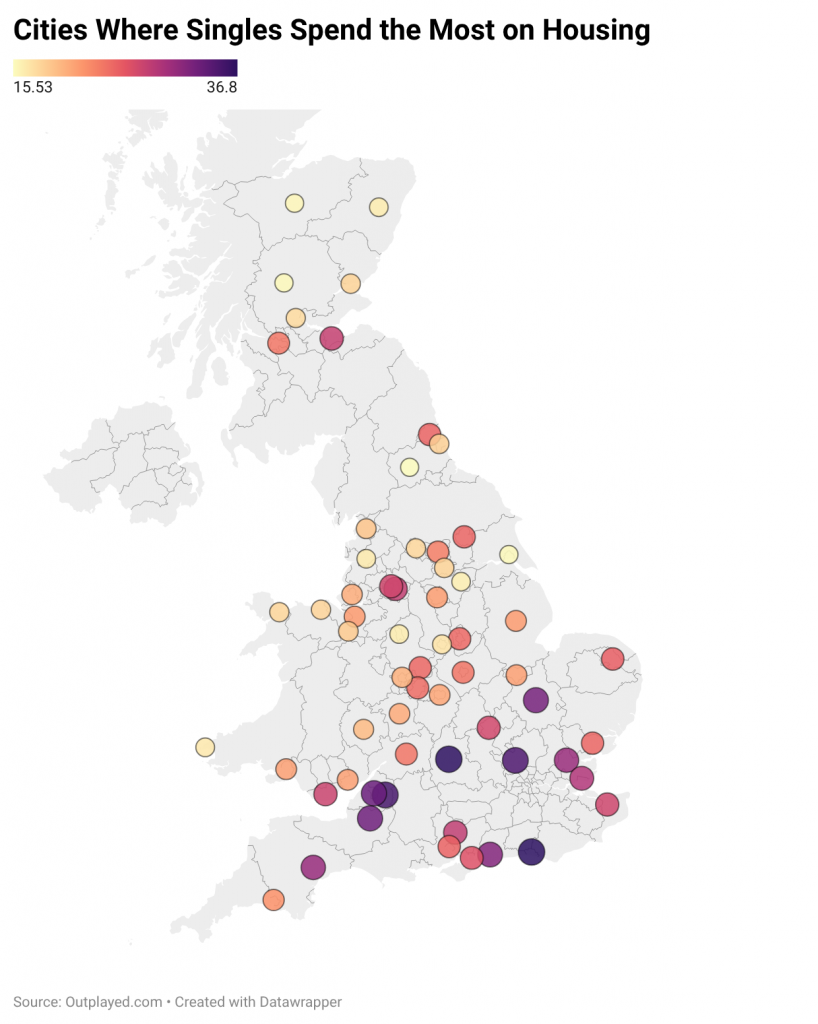
The map above reveals the stark affordability contrasts across Great Britain, with a dramatic North-South divide clearly visible. Southern coastal cities and historic university towns dominate the least affordable rankings, with Brighton and Hove topping the list, where singles face a crushing financial burden with over half their income consumed by rent alone. Oxford, Bath, and St Albans follow closely behind, alongside other sought-after southern locations like Bristol, Cambridge, and Exeter.
In stark contrast, the ten most affordable cities paint a completely different picture: northern cities like Durham, Kingston upon Hull, and Doncaster, Scottish cities including Perth, Inverness, and Aberdeen, and Midlands locations such as Stoke-on-Trent and Derby offer significantly better value for single renters. This geographic clustering highlights how regional wage disparities and housing market pressures combine to create vastly different financial realities for single Brits depending on where they choose to live.
Cities Where Singles Spend the Highest Share of Income on Housing
Brighton and Hove ranks as the most expensive city for single renters, where residents spend 36.8% of their monthly earnings on housing, based on an average one-bedroom rent of £1,203 and median earnings of £3,269.
Oxford follows in second place, with average one-bedroom rents of £1,316 accounting for 36.75% of median monthly earnings (£3,581).
In third place, Bath sees single renters spending 35.32% of their income on housing, with average monthly rents of £1,144 and median earnings of £3,239.
St Albans ranks fourth, where a one-bedroom home costs an average of £1,244 per month, equating to 35.01% of median monthly earnings (£3,533).
Rounding out the top five is Bristol, with average monthly rents of £1,208 accounting for 33.29% of median earnings (£3,629).
Top 20 Cities Where Singles Spend the Highest Share of Income on Housing
| City | 1 Bedroom House Price Monthly Average | Median Monthly Earnings | Rent Percentage |
| Brighton and Hove | 1203 | 3269 | 36.8 |
| Oxford | 1316 | 3581 | 36.75 |
| Bath | 1144 | 3239 | 35.32 |
| St Albans | 1244 | 3533 | 35.01 |
| Bristol | 1208 | 3629 | 33.29 |
| Wells | 1015 | 3066 | 33.11 |
| Cambridge | 1240 | 3793 | 32.69 |
| Chichester | 924 | 2892 | 31.95 |
| Exeter | 915 | 2962 | 30.89 |
| Chelmsford | 1053 | 3425 | 30.74 |
| Southend-on-Sea | 853 | 2905 | 29.36 |
| Winchester | 981 | 3442 | 28.5 |
| Manchester | 975 | 3442 | 28.33 |
| Edinburgh | 1018 | 3607 | 28.22 |
| Cardiff | 889 | 3187 | 27.9 |
| Canterbury | 836 | 3031 | 27.58 |
| Salford | 876 | 3187 | 27.49 |
| Milton Keynes | 947 | 3460 | 27.37 |
| Portsmouth | 881 | 3308 | 26.63 |
| Norwich | 775 | 3022 | 25.65 |
Cities Where Singles Spend the Lowest Share of Income on Housing
Durham emerges as the most affordable city for single renters, with the average monthly cost of a one-bedroom home at £434. With median monthly earnings of £2,794, this means just 15.53% of income is spent on rent, the lowest proportion in the study.
Perth ranks second, where single residents spend 15.79% of their monthly earnings on housing, based on an average one-bedroom rent of £513 and median earnings of £3,248.
Kingston upon Hull follows closely behind, with average monthly rents of £475 accounting for 15.83% of median earnings (£3,001).
Inverness takes fourth place, with single renters spending 15.96% of their income on housing. Average one-bedroom rents stand at £521, compared with median monthly earnings of £3,265.
Rounding out the top five is Doncaster, where a one-bedroom home costs an average of £477 per month, equating to 16.41% of median monthly earnings (£2,906).
Top 20 Cities Where Singles Spend the Lowest Share of Income on Housing
| City | 1 Bedroom House Price Monthly Average | Median Monthly Earnings | Rent Percentage |
| Durham | 434 | 2794 | 15.53 |
| Perth | 513 | 3248 | 15.79 |
| Kingston upon Hull | 475 | 3001 | 15.83 |
| Inverness | 521 | 3265 | 15.96 |
| Doncaster | 477 | 2906 | 16.41 |
| Aberdeen | 600 | 3611 | 16.62 |
| Stoke-on-Trent | 502 | 3018 | 16.63 |
| Preston | 556 | 3321 | 16.74 |
| St Davids | 521 | 3079 | 16.92 |
| Derby | 591 | 3442 | 17.17 |
| Stirling | 596 | 3356 | 17.76 |
| Bradford | 536 | 2979 | 17.99 |
| Bangor (Wales) | 521 | 2879 | 18.1 |
| St Asaph | 530 | 2910 | 18.21 |
| Wakefield | 552 | 3027 | 18.24 |
| Dundee | 561 | 3074 | 18.25 |
| Sunderland | 513 | 2780 | 18.45 |
| Wrexham | 584 | 3092 | 18.89 |
| Lancaster | 574 | 2979 | 19.27 |
| Hereford | 599 | 3018 | 19.85 |
Complete Rankings
| City | 1 Bedroom House Price Monthly Average | Median Monthly Earnings | Rent Percentage |
| Brighton and Hove | 1203 | 3269 | 36.8 |
| Oxford | 1316 | 3581 | 36.75 |
| Bath | 1144 | 3239 | 35.32 |
| St Albans | 1244 | 3533 | 35.01 |
| Bristol | 1208 | 3629 | 33.29 |
| Wells | 1015 | 3066 | 33.11 |
| Cambridge | 1240 | 3793 | 32.69 |
| Chichester | 924 | 2892 | 31.95 |
| Exeter | 915 | 2962 | 30.89 |
| Chelmsford | 1053 | 3425 | 30.74 |
| Southend-on-Sea | 853 | 2905 | 29.36 |
| Winchester | 981 | 3442 | 28.5 |
| Manchester | 975 | 3442 | 28.33 |
| Edinburgh | 1018 | 3607 | 28.22 |
| Cardiff | 889 | 3187 | 27.9 |
| Canterbury | 836 | 3031 | 27.58 |
| Salford | 876 | 3187 | 27.49 |
| Milton Keynes | 947 | 3460 | 27.37 |
| Portsmouth | 881 | 3308 | 26.63 |
| Norwich | 775 | 3022 | 25.65 |
| Southampton | 857 | 3386 | 25.31 |
| Newcastle upon Tyne | 783 | 3100 | 25.26 |
| York | 837 | 3317 | 25.23 |
| Colchester | 820 | 3260 | 25.15 |
| Lichfield | 700 | 2789 | 25.1 |
| Nottingham | 727 | 2914 | 24.95 |
| Birmingham | 816 | 3295 | 24.77 |
| Leicester | 715 | 2944 | 24.29 |
| Gloucester | 712 | 2949 | 24.14 |
| Glasgow | 830 | 3451 | 24.05 |
| Leeds | 758 | 3209 | 23.62 |
| Plymouth | 690 | 3083 | 22.38 |
| Chester | 690 | 3161 | 21.83 |
| Lincoln | 655 | 3009 | 21.77 |
| Sheffield | 678 | 3126 | 21.69 |
| Swansea | 661 | 3074 | 21.5 |
| Peterborough | 679 | 3161 | 21.48 |
| Newport | 688 | 3204 | 21.47 |
| Coventry | 751 | 3555 | 21.13 |
| Worcester | 680 | 3260 | 20.86 |
| Liverpool | 661 | 3191 | 20.71 |
| Wolverhampton | 634 | 3105 | 20.42 |
| Hereford | 599 | 3018 | 19.85 |
| Lancaster | 574 | 2979 | 19.27 |
| Wrexham | 584 | 3092 | 18.89 |
| Sunderland | 513 | 2780 | 18.45 |
| Dundee | 561 | 3074 | 18.25 |
| Wakefield | 552 | 3027 | 18.24 |
| St Asaph | 530 | 2910 | 18.21 |
| Bangor (Wales) | 521 | 2879 | 18.1 |
| Bradford | 536 | 2979 | 17.99 |
| Stirling | 596 | 3356 | 17.76 |
| Derby | 591 | 3442 | 17.17 |
| St Davids | 521 | 3079 | 16.92 |
| Preston | 556 | 3321 | 16.74 |
| Stoke-on-Trent | 502 | 3018 | 16.63 |
| Aberdeen | 600 | 3611 | 16.62 |
| Doncaster | 477 | 2906 | 16.41 |
| Inverness | 521 | 3265 | 15.96 |
| Kingston upon Hull | 475 | 3001 | 15.83 |
| Perth | 513 | 3248 | 15.79 |
| Durham | 434 | 2794 | 15.53 |
Methodology
This study analysed 62 cities across Britain to identify where single people face the greatest financial burden from renting. Locations in London were not included in this study.
We collected data from two official Office for National Statistics (ONS) sources. Rental prices came from the ONS Private Rent and House Prices bulletin (December 2025), which provides average monthly rent for one-bedroom properties as of November 2025. Earnings data came from the ONS Annual Survey of Hours and Earnings (2025), which shows median gross weekly earnings for full-time employees as of April 2025.
To compare rental costs against income, we first converted weekly earnings into monthly figures by multiplying by 4.33 (the average number of weeks in a month). We then calculated what percentage of monthly income goes towards rent for a one-bedroom property in each city.
Cities were ranked based on this rent-to-income percentage, with higher percentages indicating a greater financial strain on single renters.